After a relatively muted performance in June, July was again more of the same. Part of this was the overall relative poor performance of the markets. As far as my portfolio was concerned, there was outperformance vis a vis the Nifty, and I finally managed to outperform the small cap index too, but compared the SBI Magnum Midcap fund, the performance was not better.
Nevertheless, there was reason enough for satisfaction. My performance might have been even better, had I not lost some money in speculation based short term trading. I am still not able to do this well, and maybe I should just stop doing it. That, or I need to control my psychology better.
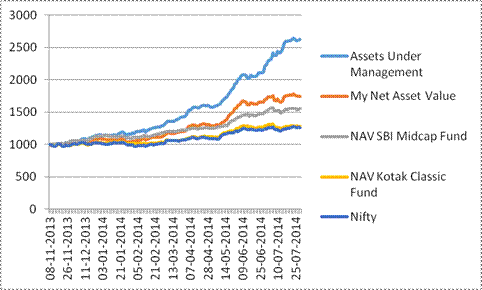
Here is the familiar graph of overall fund performance. As you can see, the total assets undermanagement are increasing very rapidly. This is because I am deploying fresh cash, and also because the portfolio is doing well.

I have tried to improve upon the graph a bit. I hope this is more intelligible than the earlier version.
Also, as always, a table of rolling returns:
| Returns | My Portfolio | Kotak Classic | SBI Midcap | Nifty |
| Last Month | 5% | 1% | 5% | 2% |
| Last 3 Months | 42% | 14% | 24% | 15% |
| Since Nov, 2013 | 75% | 28% | 56% | 26% |
As you can see, since Nov 2013, my portfolio, in terms of the NAV, has increased by 75%. The Nifty, meantime, has increased only by 26%, and the SBI Magnum Midcap fund, by 56%. In a blended sense, between the Kotak Classic Fund and the SBI Midcap Fund (Blended in a ratio of 1:2. similar to the ratio of large caps to small caps in my portfolio), the outperformance in 3 quarters is around 30%.
As always, to understand how the NAV for my portfolio has been arrived at, I would refer you to the following post: Understanding the NAV Calculation
