Investment Performace June 2018
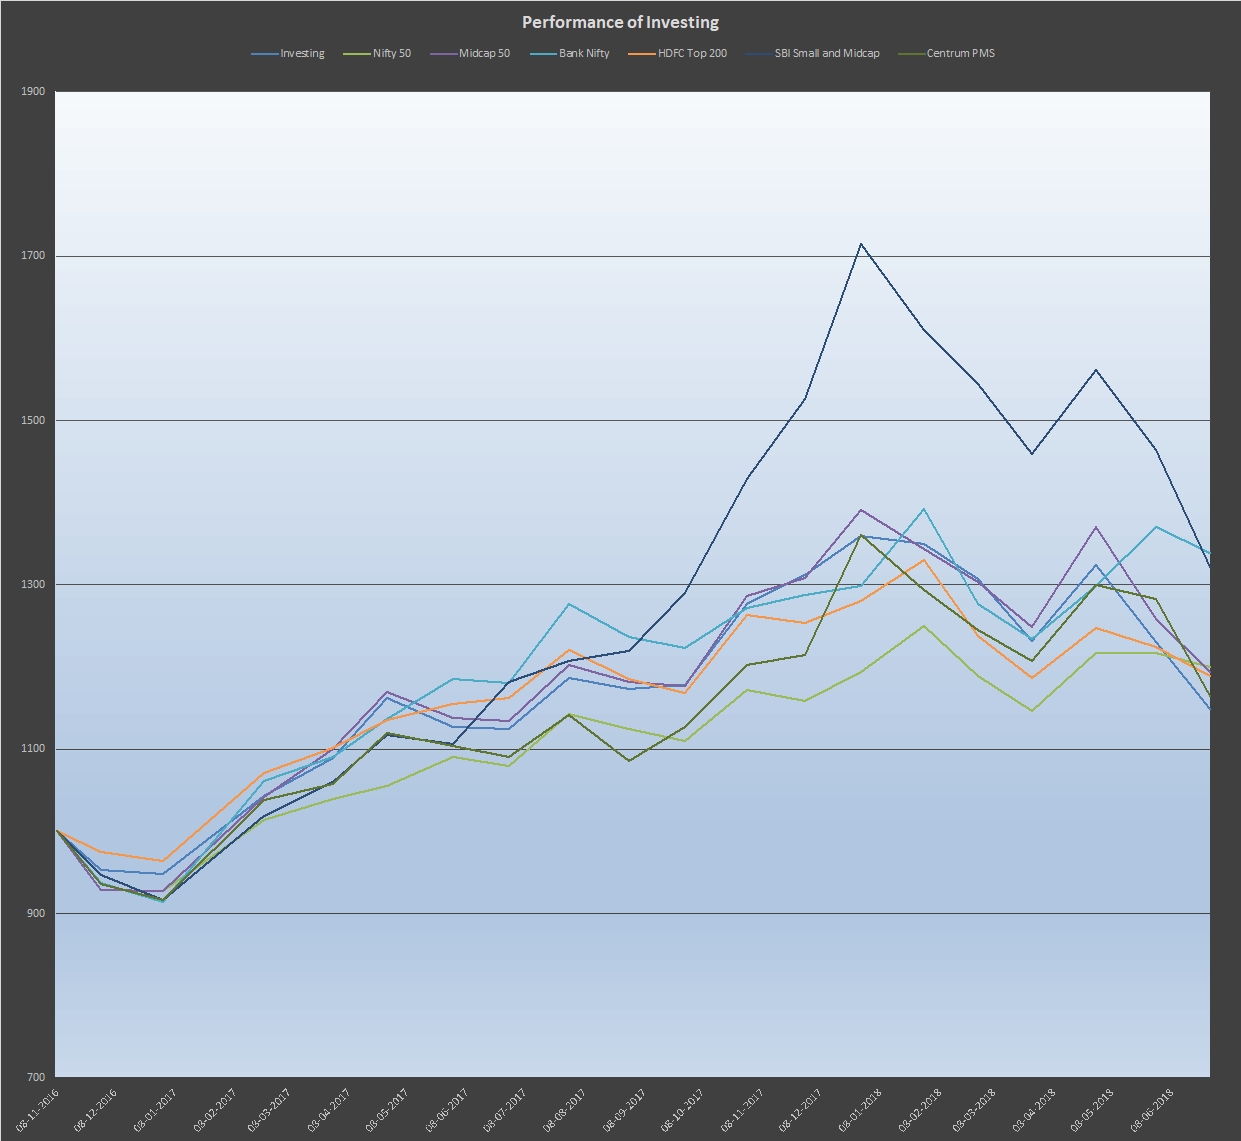
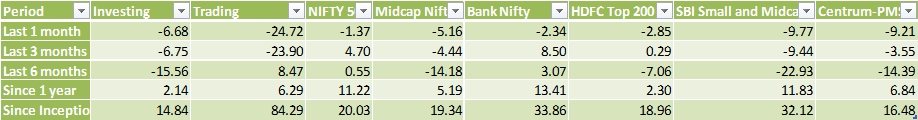
Below is a graphical representation of my investment performance in relationship to various benchmarks. Below that is a table showing the investment returns over the last year and more for my investment account, my trading account and various market benchmarks, including indices and popular mutual fund schemes as well as a decent PMS scheme.
Since Jan 2018, the markets have given a rocky ride, especially to those portfolios which are small and midcap driven. In fact, my performance is worse than any of the benchmarks over the last 18 months and over the last 12 months. This underperformance is quite disappointing, and another couple years of that, and it will be clear that I am not cut out for the investment game and am better off investing through mutual funds or index funds.
My portfolio was down more than 15% in the last six months, a figure which is only exceeded by the SBI small and midcap fund. But overall over 18 months, there is huge outperformance of the SBI Small and Midcap Fund.
Which were the stocks which performed the worst? I think KRBL, which got enmeshed in a scandal, IDFC Bank and IDFC Ltd. which just don’t seem to recover. Other stocks which did badly include CanFin Homes, Oberoi Realty (in absolute terms, rather than percentage terms), HPCL, DCM Shriram and EID Parry. The former because of rise in oil prices, and the latter two, due to the sharp downturn in the sugar cycle.
In the 3 months since my last report, my portfolio has been standstill, where I have not added or subtracted anything or bought or sold anything new.