
Trading Returns and Performance
July 2017 was a great month for my trading performance. Here is a table which shows the trading returns over the last nine months.

As can be seen, my trading activity gave a return of 59% in July 2016 alone. This was in conjunction with a rise in the bank nifty of 8.15%. However, as I kept withdrawing capital from trading and deploying it in debt, I am not clear as to what the trading capital showed be considered. In any case, trading activity for me is a business which created income, not a wealth generating activity. Hopefully, wealth will get generated through my debt, equity and real estate portfolio. So I am far more interested in the absolute returns from my trading activity.
This month, I also started trading commodities in earnest. The total capital set aside for commodities is still a fraction of the total for the Bank Nifty. Hopefully, over a period of time, this shall rise.
Currently, I am trading Crude/Natural Gas, Gold/Silver, Zinc/Copper. I feel that trading a basket of instruments shall improve the stability of my trading performance. However, I am still not confident of increasing the position size of the commodity basket. Over a period of time, I shall slowly increase this.
Below is my trading equity curve till July 2017.
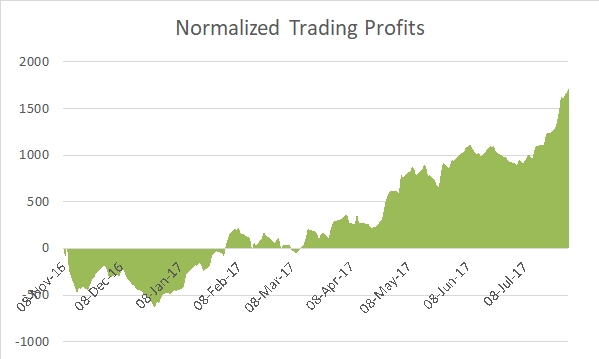
What about drawdown? Well, in July 2016, there were several days where the trading equity was at the maximum, and there was no drawdown at all.
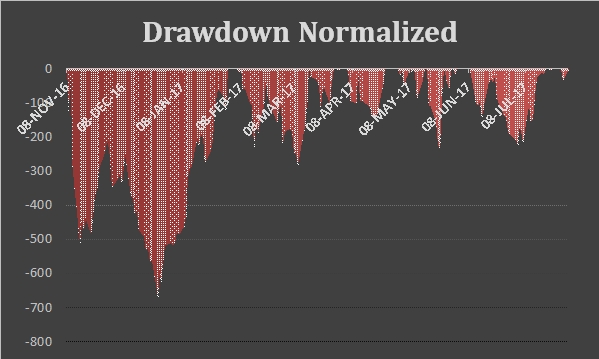
Here is the drawdown:
All in all, a very satisfying performance in trading activity in July 2017.