Trading Returns February 2019

The below table summarized my trading returns, along with my investment returns over the last 27 months. As you can see, trading has given me exceptional returns over the last 27 months, but poor returns over the last year.

Trading Returns over the last 27 months, since inception.
Trading Returns compared with Investment Returns as well as a number of other benchmarks.

The months of January and February have been particularly bad for my trading returns. The BankNifty (which constitutes almost 80% of my trading portfolio) yo-yoed in a strict range for 2 months. In addition, I think we biased ourselves in favor of extremely fast strategies. This had a tendency to really ruin returns in such a market environment.

The important thing to note is that we still have positive returns for banknifty trading till February in the financial year 2018-19. The loss has come almost entirely from commodity futures, interest rate futures and options trading. For six months, though, we quite outshone every other benchmark by trading. This was because of a wonderful run in August and September.

This is all what trend following trading is all about. Sharp bouts of phenomenal performance, followed by a long period of drawdown. The challenge for any portfolio constructor is to minimize the extent and frequency of drawdown. We are still in a learning phase as far as that is concerned.

Investment Returns February 2019

I have not disclosed my investment returns since a few months. This is because I started a new portfolio of trading stocks, which have a lot of churn. So I just had to understand how to keep the two portfolios separate in my database. It took me a couple of months to get around to the point of making appropriate changes in my database, and in doing the programming changes necessary.

Here is a graph of in investment returns, also as compared to a number of benchmarks.

Investment returns for the period from November 2016 to February 2019, as compared to various benchmarks, including a PMS, TRI Indexes, and top mutual funds.

As you can see, the top performance over the last 2 years or so is no longer the SBI Smallcap fund. Riding on the basis of largecap outperformance throughout 2019 the NIFTY TRI remains the best performer of all benchmarks, followed closely by the HDFC Top 100 Fund.

Again both mutual funds, the HDFC Top 100 and the SBI Smallcap Fund, outperformed both my portfolio as well as the PMS.

Clearly performance is dictated by the kinds of stocks which constitute the portfolio, given the exceptionally large divergence in the returns of a large cap, midcap and small cap portfolio over the last year.

As I write this post, there has again been smallcap and midcap outperformance in the last month. We will see the results next month.

Benchmarks against which to measure performance

In the table, I give three figures which reflect my own performance along with other benchmarks:

Every month, I have been giving out a summary of my trading and investment performance. Here I give my own performance, along with other benchmarks. The question is, what are these benchmarks? Are they appropriate? How should one look at these benchmarks. Here I will just elaborate on these benchmarks.

a) My investment returns: This is for that capital which is deployed on a long term basis, without any leverage. The typical churn in this part of my portfolio is less than 10% a year. My investment returns as given include dividends received on stocks.

b) My trading returns: Trading returns are those returns which are given for the various trading strategies I employ. These returns in percentage terms are only on the actual capital employed (cash+cash equivalents like liquid bees). The percentage returns do not reflect the fact that approx 40% of the capital is in stocks of companies which are pledged as security. These returns must be evaluated accordingly. My trading returns also include my returns on commodity futures and interest rate futures, as well as the occasional option trade. Most such trades are always in the market (i.e., they are not long-flat, they are long-short). When the trend reverses, typically, my trade will move from long to short or vice versa.

c) My returns on traded equity: This is more recent. Since October 2018, I have deployed a significant amount of capital (Approx 15% of the total capital in my investment portfolio) into equity shares on a non-leveraged basis. The basis for selecting these stocks is purely by trend following techniques. These stocks are not meant to be invested for the long term. As soon as the trend reverses, there will be a sell. This is a long-flat strategy. No shorting is done.

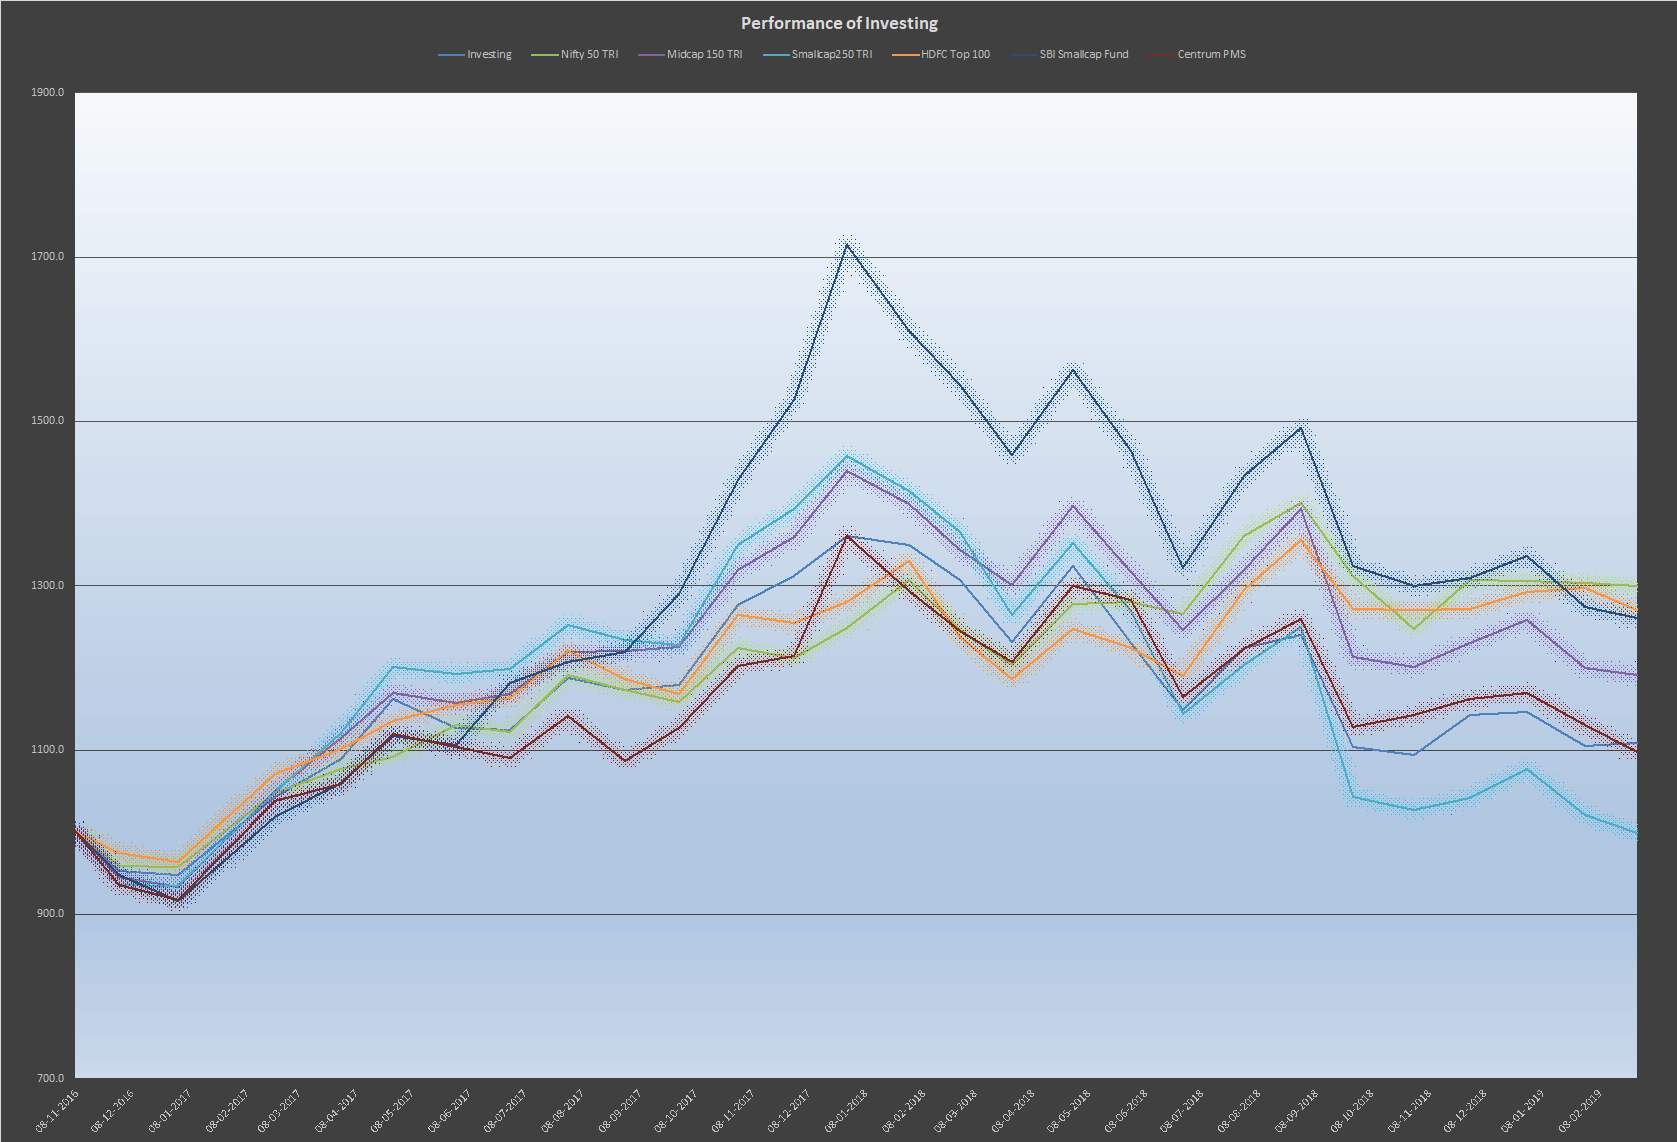
Coming to the various benchmarks:

a) I have indicated the Nifty Total Return Index(TRI), Midcap-150 (TRI) and Smallcap-250 (TRI) as the appropriate benchmarks for my portfolio. My current investment portfolio consists of 20% large caps, 50% midcaps and 30% small caps. So my actual returns should be someway better than the returns of these three strategies combined in the above proportion.

b) Among other benchmarks, I have also included 2 mutual funds, both of which are famous outperformers in their respective categories. They are not the category average. These two benchmarks include the HDFC Top 100 fund (Used to be the HDFC Top 200 fund earlier), and the SBI Small Cap Fund (Used to be the SBI Magnum Small and Midcap Fund earlier).

c) I have also indicated the returns from the Centrum-920 Deep Value PMS (in which I have invested a small amount), so that my investment returns can be benchmarked with it.

d) Finally, I have indicated returns provided on a small amount of trading capital to an individual named Chandan Kumar, who trades it on my behalf, using options strategies that he has developed. My trading returns could be compared with his returns, since he uses similar amounts of leverage.

Trading Strategies currently Deployed

Currently, I am employing the following trading strategies in financial markets:

b) Trend Following on the BankNifty Futures on EOD time frame, with a mix of fast responding and slow responding strategies (Approx 30% of total capital)

a) Trend Following on the BankNifty Futures on 5 min, 15 min and 30 min timeframes (Approx 10% of total capital)

c) Mean reversion trades on Stock Futures (Approx 5% of total capital)

d) Trend Following on Interest Rate Futures (Approx 10% of total capital)

e) Momentum and Trend Following on Commodity (Silver, Gold, Zinc, Crudeoil and Copper) Futures (Approx 10% of total Capital).

f) Trend following on NSE500 stocks (non-leveraged) (Approx 35% of total capital)

Capital is employed by means of 50% stocks (with about 25% haircut), 40% liquid bees(10% haircut) and 10% cash. Non leveraged trades on NSE 500 stocks needs cash too.

To protect against black swan events, I generally buy protective puts in BankNifty weekly options in the situation where more than 50% of the maximum position is long.

Trading Performance September 2018

Trading Performance September 2018 

After a very disheartening trading performance in August 2018, September 2018 gave stupendous returns. This was due to an extremely sharp fall in the Bank Nifty, and an extremely sharp rise in bond yields. This behavior is not unexpected, but the correlation of bond yields and the Bank Nifty does lead some degree of correlation, which is not what was expected while diversifying to a new instrument. 

Unfortunately, I stopped trading commodities a few months ago, and I also reduced the position size on bond futures. The commodities was a conscious choice, because I wanted to refine my strategies and also see if existing strategies did have an ‘edge’. The bond futures position size reduction was a ‘fear’ thing. 

Nevertheless, the nice returns on the bank nifty in September were a nice bonus. It also meant that I have positive 1 year returns. And of course, since the inception of measurement, i.e., November 2016, it means a return of almost 200%.

As of now, there are 3 operating trading segments:

a) Trend Following on the Bank Nifty, which constitutes nearly 70% of the total position. This is on various time frames, with shorter time frames having 50% of the positions, and daily time frame having 50% of the position

b) Trend Following on Yields, to trade on bond futures

c) Mean Reversion Systems on individual stock futures

Currently, momentum trading on commodities is in suspension. Also, I very occassionally do options plays. In the beginning of October, I have also started trend following in individual stocks(taking delivery).

Portfolio Returns
Investment and Trading Performance Compared with Various Benchmarks

Investment Performance September 2018

Investment Performance- September 2018

September 2018 was not a good month for my investment performance. My portfolio fell by nearly 11% in a single month. The only saving  grace was that it did not underperform most benchmarks. The SBI Small Cap fund fell even more, and the Centrum PMS and Bank Nifty did almost as badly.

The Centrum PMS was 25% in cash by the end of September. As a ‘Buy and Hold’ Investor, one does not have the luxury of moving to cash.

But as I approach 5 years of active investing, and nearly 2 years since I have kept perfect records, one has to ask oneself hard questions. Since Nov 2016, my portfolio has significantly underperformed good mutual fund schemes. It may not have underperformed the average of all equity mutual fund schemes, but it has not outperformed such an average either. 

It is clear, from the record of 2 years, that something needs to change. I would question the need for me to study companies, look at balance-sheets, attend con-calls, and the like. Isn’t it better to spend my time in other pursuits, and invest in a few good mutual funds instead?

But of course, I also need something to do. And for that, I would question the validity of ‘Buy and Hold’ investing for the entire portfolio. In the next month, I intend to post a paper on the logic of doing trend following on individual stocks, and hope to post results of back testing such strategies over the last five years. I hope I can convince myself, and others, that price action in the markets, is much more critical for markets, than fundamental analysis. I have no doubt that fundamental analysis is a valid approach, but I do feel that it leaves out a valuable component of the investing process. And that is time. If markets don’t ‘discover’ the value stock, no matter how good the analysis and how correct the thesis, it can be a long time before the market assigns the stock the multiple it may ‘deserve’. And during this time, there may be another stock which fully deserves a look.

So for my incremental investing, I intend to stop investing on a fundamental basis. Incremental cash will go to a long/flat portfolio, where candidates are identified using trend-following methods. Fundamental analysis will be used to rule out investment in certain stocks, more in a negative sense than in a positive one.

Here is a figure which gives the investment performance for September 2018, along with a comparison with other benchmarks.

Investment Performace
Investment performance from November 2016 to September 2018 compared with various benchmarks.
Portfolio Returns
Investment and Trading Performance Compared with Various Benchmarks

Trading Performance July 2018

Trading Returns July 2018

Markets had sustained momentum in July 2018, which led to stellar trading returns for the month. The trading performance would have been better had I not stopped trading commodities in June. I am still heavily underwater in bond futures too, though bank nifty futures gave marvelous performance in July.

Here is a tabulation of the returns over different time frames:

Portfolio and Trading Returns
Investment and Trading Performance over different time frames, updated to July end 2018

Investment Performance July 2018

Investment Performance July 2018

After the last investment performance of June 2018, markets certainly performed better in July 2018. Consequently all of the benchmarks 5.4% to 8.8% for the month, but my portfolio rose a nice 15.4% for the month. Being mid and small cap oriented, my portfolio has almost been flattish over the last six months, but that compares well to mid and small cap funds or PMS, though not so well with Large Cap Oriented Funds.

Portfolio Returns
Investment Performance in comparison to various benchmarks

Here is information in the above graph in a easier to read tabulated form. 

Portfolio and Trading Returns
Investment and Trading Performance over different time frames, updated to July end 2018

Portfolio Disclosure August 2018

Portfolio as on August 14, 2018

The last portfolio update was from April 1, 2018. The previous one was from January 11, 2018. You can see the posts to see how the portfolio has evolved.

The period between April and August ranked as a very quiet period for the portfolio. In the backdrop of a market which saw a most significant drop in mid and small cap stocks, I have kept a steady mind and not added to my portfolio significantly. And I practically did not sell anything.

So even if stocks like Cummins and CanFin Homes don’t show up below, it is not because I have sold them, but it is because they have dropped significantly in price

Ticker%Holding%Gain
OBEROIRLTY9.92820109100.7389031
BAJAJFINSV6.477362098584.3156905
BALKRISIND4.827414464854.8102085
RELIANCE3.141373436145.4024903
NESCO2.99195037994.20803713
IDFC2.903468444-34.67711586
ECLERX2.7233901722.40189086
IDFCBANK2.646109761-15.16482853
PIIND2.55759000789.2116148
IBULHSGFIN2.351455379211.7275731
HINDPETRO2.313747893-6.682749521
BAJAJELEC2.226524619149.550775
DCMSHRIRAM2.216112597195.6455247
AARTIIND2.206118255295.4931729
INDHOTEL2.15943236558.86217483
MCDOWELL-N1.9862008193.622785379
AKZOINDIA1.91899612340.58223222
MUTHOOTFIN1.824528372-4.569865042
LT1.81937309112.31911761
BHARATFORG1.724144551251.7061113
TATAINVEST1.69913900750.33357316
OCCL1.655586215805.9310102
SPARC1.600213338159.6256163
GRINDWELL1.584730835293.9522669

Of my portfolio stocks, Oberoi Realty, IDFC twins, HPCL, DCM Shriram, KRBL, CanFin Homes underperformed the market significantly. On the other hand, Bajaj FinServ, Reliance, Balkrishna Tyres gave excellent returns during this period.

Portfolio Disclosure April 2018

Portfolio Dislosure April 2018

After the last portfolio disclosure in Jan 2018, there were quite a few changes to the portfolio, but only in the ones where the holding was small. There were really no core changes to the portfolio since the last disclosure:

Ticker%Holding%Gain
OBEROIRLTY10.62546011113.8797772
BAJAJFINSV4.730678304397.5568785
BALKRISIND3.88259142664.5134899
NESCO3.161791756104.3182081
HINDPETRO2.96784413419.16479847
PIIND2.886474972112.5913834
IDFC2.849247583-36.18255307
IDFCBANK2.825004433-9.832876109
ECLERX2.7386308337.732010409
DCMSHRIRAM2.50701572232.9641992
RELIANCE2.30075846178.93340345
IBULHSGFIN2.263550282198.7374152
BAJAJELEC2.258306071151.9853078
INDHOTEL2.24454951464.38836803
CANFINHOME2.1143087271056.600621
MCDOWELL-N1.9972582673.735481891
BHARATFORG1.957663073297.5622922
LT1.9115806317.48584183
AARTIIND1.882093914235.9019224
AKZOINDIA1.82380154251.84341855
MUTHOOTFIN1.818411293-5.313506663
IRB1.7159106467.8419657
OCCL1.63109147788.5515663
AJANTPHARM1.586038659157.8488374
SPARC1.576868608154.6983655
TATAINVEST1.57546252838.77017767
GRINDWELL1.575281193289.8586545
SHILPAMED1.557782875150.0245445
NMDC1.556485759-7.583080722
HMVL1.540433076.75067626
HINDZINC1.50401943361.28020634

The last portfolio update was at a time when the market was at an all time high. The portfolio has shrunk then, both as a result of market correction, as well as significant pruning of the portfolio. Among stocks that did well, I would include Bajaj Finserv and Bajaj Electricals. The IDFC twins and HPCL did poorly.