The Momentum Factor

That momentum influences stock prices is well known since a long time. Two Centuries of Momentum is an article which summarizes the evidence of momentum in financial markets since the last 200 years. It also gives a behavioural basis and an information theory basis for the prevalence of momentum, and thus extends the purist approach to momentum being a ‘risk factor’ for which a risk premium should exist in the form of superior returns.

Momentum is simply a restatement, in financial market terms, of Newton’s First Law of Motion. Prices which have risen a lot, tend to keep rising, and prices which have fallen a lot, tend to keep falling.

There are hundreds of studies in the academic literature to show that momentum works. Even if we see the records of many successful investors, you can find that they often choose stocks which have high momentum, and their buying propels them even more.

How can you measure momentum in stock prices? Well there are many ways to do so. One of the simplest approaches is to measure returns over a lookback period, typically 12 months, rank the stocks in the investing universe on these 12 month returns, and then buy the top quintile (or buy the top quintile and short the bottom quintile). By top quintile, I mean the top 10% of stocks in the investing universe. When we mean ‘investing universe’. it is usually related to a benchmark, like an index. So you take all the stocks in an index, and buy the top 10%.

What about allocation of stocks within this top 10%, or top 5%? There are many weighting schemes possible, but the two most common ones are equal weighted and factor weighted. This is best explained by an example. Suppose you take the NSE50 as the benchmark, and rank all 50 stocks by the returns over the past 365 days (the ‘Look Back Period’). Suppose you now choose the top 10% of stocks (i.e., the top 5 stocks). If you wish to invest 10 lakhs at this time, one option is to allot 2 lakhs towards buying each of the 5 stocks. This is equal weighting. Factor weighting involves alloting more than 2 lakhs to the highest ranked stock, and less than 2 lakhs to the lowest ranked stock of the 5 stocks. That is, factor weighting gives more allocation to higher ranked stocks than to lower ranked stocks and equal weighting gives the same allocation to all the selected stocks.

There are many ways to measure momentum. One is to simply rank the stocks on their returns of the last 365 days. Another way is a variation of this. At the end of the 12 month, you rank stocks on their returns after 11 months, and give a rest period of 1 month. This is based on the idea that momentum typically flags after 11 months, before resuming.

A third way to measure momentum is to to examine the distance between the stock price and a long period moving average (say the 200 period moving average).

A fourth way to measure momentum is to look at what a call Alpha Momentum. Recall our discussion in the previous post on the CAPM, where we said that stock prices move because of the market factor. In other words, this can be expressed as

Return of the stock=A+B(Return of the Market-Risk Free Rate)+C

A is known as Alpha, B is Beta and C is a noise term. Beta signifies how much the stock moves with the market. If Beta is small (i.e., less than 1), than the stock price will move less than the index movement. If Beta is large, small market movements will cause large changes in the stock price.

Alpha is idiosyncratic. Both Alpha and Beta are typical of the stock in question. High Alpha means that a large part of the stock movement is not explained by the market factor alone. Low Alpha means that the stock moves more or less in line with the market. If the market rises, it rises, and if the market falls, the stock falls too.

So Alpha is a sort of idiosyncratic momentum term, and we can rank stocks in terms of Alpha as well. This turns out to be a very potent way of measuring momentum, as we will see.

The Value Factor

In the original research, the Value factor was quantified quite simply by Price to Book. A low price to book value implied higher value and a high price to book value implied lower value. Studies showed that firms with lower price to book values outperformed, over time, firms with higher price to book values.

Most people today quantity Value in a broader sense than simply price to book. The NSE 500 Value 50 index , which seeks to identify stocks with a strong ‘Value’ factor, used a composite of price to book, price to earnings, price to sales and dividend yield to rank stocks from the NSE 500 on value, and then to identify the 50 stocks with the most value.

The value factor has given tremendous returns over time, over broader equity indexes. However, since the last 5-7 years, value stocks have significantly underperformed, both in India and Internationally. For example, in the 5 years preceding this post, the NSE 500 Value 50 index has only returned 2.26%, when the NSE 500 itself (the benchmark from which these 50 stocks are drawn) has returned 11.36%.

The jury is out on whether the Value factor is still ‘valuable’. Some pundits swear by it, and say that it is just a matter of time before value comes roaring back. Some pundits argue that value still matters, except that the value of stocks now has many intangibles compared to the past, and the metrics given above don’t quantify this intangible value well. Hence the failure of value strategies. Then there are others who argue that stock markets now only value growth and quality, and ‘value’ stocks are usually ones which are not good quality stocks, and therefore, the value factor must be junked.

Personally, I am in the second camp, where I feel the Value is an enduring quality which predicts future expected returns in stocks. The value factor will make a comeback. However, perhaps we do need to tweak the value factor to account for the fact the traditional metrics don’t necessarily capture the value embedded in some new age businesses, and that we do need to consider things like brand value, number of active users and so on to correctly arrive at a value of new style businesses.

The Size Factor

Size: The Size factor is easy to quantify. It says that small firms, over time, give higher returns than large firms. The size of the firms is typically measured by market capitalization. All other things being equal, what this implies is that small cap and mid cap funds and stocks should, over time, outperform large cap funds or stocks.

Some caveats here are useful. While the original research around factors showed a strong size effect, over time, many academicians have criticized the methodology of these original studies and disputed whether such a size factor actually exists. In India, moreover, we also have the challenge that it is sometimes difficult to trust the corporate governance in small firms.

So my suggestion is that instead of explicitly choosing small over big, it is better to select stocks from a broader benchmark (like the NSE500) than a benchmark with only large cap stocks (like the NSE 50). Once the broader benchmark is selected than you can tilt it towards the other factors as mentioned below. This ensures that you are choosing stocks with a tilt towards smaller stocks without explicitly pitting off small against big.

Factors to Improve Investment Performance

In the previous post, we saw that certain ‘factors’ or ‘risk premia’ can predict equity portfolio performance over and above the market factor. That is, using the knowledge of certain factors and tilting your portfolio to contain more of such factors, can help to improve performance over the market (or index fund) portfolio.

Willy nilly, all equity portfolios tilt towards some or the other factor. Once we examine the useful factors, I will give examples in the following posts of how these factors can be used, or how you can take a portfolio (say a portfolio owned by a mutual fund), and see what factor tilts the portfolio manager has created, even if unconsciously.

Six factors have stood the test of time, are popular, and have both risk-based and behaviour-based explanations for their performance. These are A) Size-small stocks give better results than large stocks B) Value-stocks with high ‘value’ give better returns than stocks which represent low ‘value’. C) Momentum-stocks which are moving higher continue to give better returns for a certain time than stocks which are moving lower. D) Low Risk-Stocks with low risk give better returns than stocks with high risk E) Quality-Firms which have higher quality give better stock returns than firms with poor quality and F) Investment- Firms which tend to invest low amounts give better stock returns in time than firms where large amounts of money are needed to be invested.

Table 1 summarizes these six factors, and also provide an explanation for why these factors ‘work’ to give higher stock returns. These explanations are often a subject of academic debate. This debate need not concern us, but a risk factor with a strong risk-based explanation is more likely to continue to have a premium in the future. It is more reassuring for an investor to have a risk-based explanation. In an efficient market with rational investors, systematic differences in expected returns should be due to differences in risk. Sometimes, its not about risk. Behavior of participants in equity markets often deviates from rational choice in the short run. The best factors are perhaps those which have sound risk-based and behavior-based explanations.

FactorFactor DefinitionRisk-Based ExplanationBehaviour-Based Explanation
SizeStocks with low market cap versus stocks with high market capLow Liquidity needs to be compensated by higher returnsSmall-Cap stocks don’t attract sufficient investor attention
ValueStocks with high book-to market versus stocks with low book-to-marketHigh sensitivity to shocks during stressed economic conditionsOverreaction to bad news and extrapolation of the recent past leads to subsequent return reversal
MomentumStocks with high returns over the past 12 months omitting the last month versus stocks with low returnsStocks with very high recent performance are more sensitive to sudden price falls during economic shocksInvestor overconfidence and self-attribution bias leads to returns continuation in the short term
Low RiskStocks with low volatility of returns versus stock with high volatalityLow volatility in prices leads to investors using leverage which needs to unwound during periods of economic shocks 
QualityStocks of firms with high quality (e.g. return on equity) have high returns Investors do not distinguish sufficiently between growth with high quality and growth with low quality, leading to under-pricing of quality growth firms
InvestmentStocks of firms with low investment (e.g. change in book-value) have high returnLow willingness to invest leads to these funds shying away from capital intensive projectsInvestors under-price low investment firms due to expectation errors

Some caveats here. The factor definitions are themselves not written in stone. These do vary. For example, we ourselves will examine two other definitions of momentum, and indeed, one of the other definitions gives better returns than this one. Sometimes, one can take a few definitions and combine them into an overall factor score. For example, quality can be a combination of high Return on Equity and Low Leverage. Please wait till we examine each factor in detail for the full details of the definition.

Now that we have seen what factors are, and the common types of useful factors, we can now examine individual factors a little more in detail in the next post.

Factor Investing

This is the first of a series of posts on factor investing.

In this first post, we shall introduce factors in equity investing. What are factors? How are they useful?

Early research on equity returns broadly took the position that most equity returns were market related, and it was not possible, in a broad sense, to improve upon market returns, unless you were prepared to take on additional risk. This idea, that has since led to the development of index funds, is the principal reason for the current popularity for ‘passive’ investing. The basic notion is that it is very difficult for ‘active’ managers to beat benchmark returns (especially, net of management fees), and therefore you were better off just investing in index funds.

The early research was since modified to include certain ‘factors’ which led to outsize returns over the market. These additional returns are often called ‘risk premia’, since the idea is that factors contribute to additional risk, and therefore people who are exposed to these factors need additional return to compensate them for the additional risk they are taking on. Some explanations of why factors give additional returns are behavioural, in the sense that there are some recurrent behaviour patterns amongst market participants, which lead to these apparent anomalies in stock returns.

So, let us differentiate between the ‘market factor’ and other factors. These other factors lead to differences in stock returns beyond what different levels of exposure to the market can explain.  These other factors can be intrinsic to the particular stock (such as its earnings, or growth, or price movement etc.) or they can be extrinsic (Industry Growth, Interest Rates and so on). Empirical research, sometimes data mining in the guise of research, has thrown up almost 300 factors that impact stock returns. But not all these factors have a sound economic rationale or a well-established risk or behaviour-based explanation for why they give additional returns.

In the next post, we will examine which factors have been found to be useful over time, and which we can use for improving investment performance.

Origins of Fear and Greed

A nice article trying to explain why investors suffer from greed and fear. It also explains why these are more innocent and natural than emotions which are psychopathic.

https://www.collaborativefund.com/blog/origins-of-greed-and-fear/

Some Excerpts:

Greed happens when you overestimate how influential your past actions were on outcomes, enticing you to keep pushing right up to, and beyond, the point of eventual regret.

Greed is expecting back more than you deserve given what you put in. Which is exactly what happens when you overestimate your ability to do things that will directly lead to rewards.

When you’ve overestimated how much of your actions influence your results, you miss key feedback the world tries to give you, sticking to your guns instead of updating your approach.

Saving Early. The Magic of Compounding.

Recently, I came across an article on saving early that claimed something which seems extraordinary on the face of it. It claimed that if you started saving for your child’s(!!) retirement at the time the child is born, then something extraordinary happens.

If you save 5000 Rs. a month, the article claimed, and you put the money into equities( where return was supposed to be 18% per annum, as per the article), and if you kept increasing this sum by 5% per annum (so that in year 1, you were saving 5250 per month, and in year 2, a little more than 5500 per month), and you kept saving for the first 20 years of your child’s life, and then stopped, keeping the corpus intact, then, the article claimed that at the time of your child’s retirement (Age 65), your child would have 1000 crores of Rupees.

Extraordinary, isn’t it? The magic of compounding plays out so wonderfully, when you start compounding over 65 years. I tried to do the calculation myself, and I in fact, assumed that the entire money (60000 Rs.) would be invested in the beginning of the year itself. And that led to the even more astonishing figure of Rs. 2700 crores.

Of course, this isn’t particularly realistic. The first assumption is that you would get 18% return on equities. Frankly, this isn’t a very tenable number, and very few individuals would have obtained 18% a year over 65 years (Warren Buffett is one of them, but then, he is both an owner and an investor, and he has float from insurance companies). A more realistic assumption would be something like 13-14%.

However, even if you assume a smaller return of 13%, the figure still comes to a respectable 212 crores. If you assume an inflation rate of 5%, then that comes to nearly 10 crores in today’s money, surely a comfortable sum to retire on for most people. Maybe 9 crores after taxes.

It also goes to show, the importance of saving early. It is the 65 years of compounding which causes these crazy sounding figures to come up.

Most people, of course, struggle to save for their own retirement, let alone their children. So let us look at how saving early can help such folks.

Suppose a person starts working at Age 22, and works till the retirement age of 65. Suppose they save 60000 per annum at the end of every year (or 5000 a month). And they invest it only in PPF account, which gives them 8.5% tax-free (Not counting the impact of the tax benefit of such an investment at the time of investment).

In that scenario, they would have a corpus of 2.45 crores at the age of 65.

Suppose, you start saving at the age of 30, i.e., 8 years later. In 8 years, you would have saved only Rs. 4.8 lakhs less than the individual who starts saving at the age of 22. But in this case, at age 65, you would have only Rs. 1.26 crores at the age of 65. A huge Rs. 1.2 crores less.

Maybe we take a more realistic scenario, where the amount you can save increases with time. Suppose you start saving Rs. 5000 a month at age 22, and increase this by 1/3rd every five years, then at age 65, your corpus will become Rs.4.9 crores. And if you do the same thing, starting at age 30, you would have only Rs. 2.2 crores. The difference gets even more magnified.

And this is assuming only a 8.5% return. Recently, I checked my NPS returns (I have been saving in NPS since 2010, in a 50:30:20 portfolio (50% equity, 30% Government Securities, 20% corporate bonds), which is relatively conservative. In this scenario, my return has been a little under 10.5% over these 9 years.

If we would plug in these figures, the small tweak in the return, leads to a scenario where instead of Rs. 4.9 crores in the scenario earlier, then corpus would become Rs. 8 crores (Saving Rs. 60000 every year from age 22, increasing by 1/3 every 5 years). As opposed to this, starting at age 30, the corpus would have become only Rs. 3 crores, as opposed to Rs. 2.2 crores. The higher return has dramatically magnified the advantage of saving early.

This last comparison is illustrated in the graph below.

The Importance of Saving Early is well demonstrated in this graph
Shows the cumulative corpus if Rs. 60000 is saved every year, with the sum increasing by 1/3rd every 5 years, and a return of 10.5% per annum..

The first lesson in personal finance is therefore, to start saving early. The second is to try and maximise the return. In another post, I will try and explain why, if your horizon is long, it is sensible to be a little more aggressive and bump up your returns.

Trading Returns February 2019

The below table summarized my trading returns, along with my investment returns over the last 27 months. As you can see, trading has given me exceptional returns over the last 27 months, but poor returns over the last year.

Trading Returns over the last 27 months, since inception.
Trading Returns compared with Investment Returns as well as a number of other benchmarks.

The months of January and February have been particularly bad for my trading returns. The BankNifty (which constitutes almost 80% of my trading portfolio) yo-yoed in a strict range for 2 months. In addition, I think we biased ourselves in favor of extremely fast strategies. This had a tendency to really ruin returns in such a market environment.

The important thing to note is that we still have positive returns for banknifty trading till February in the financial year 2018-19. The loss has come almost entirely from commodity futures, interest rate futures and options trading. For six months, though, we quite outshone every other benchmark by trading. This was because of a wonderful run in August and September.

This is all what trend following trading is all about. Sharp bouts of phenomenal performance, followed by a long period of drawdown. The challenge for any portfolio constructor is to minimize the extent and frequency of drawdown. We are still in a learning phase as far as that is concerned.

Investment Returns February 2019

I have not disclosed my investment returns since a few months. This is because I started a new portfolio of trading stocks, which have a lot of churn. So I just had to understand how to keep the two portfolios separate in my database. It took me a couple of months to get around to the point of making appropriate changes in my database, and in doing the programming changes necessary.

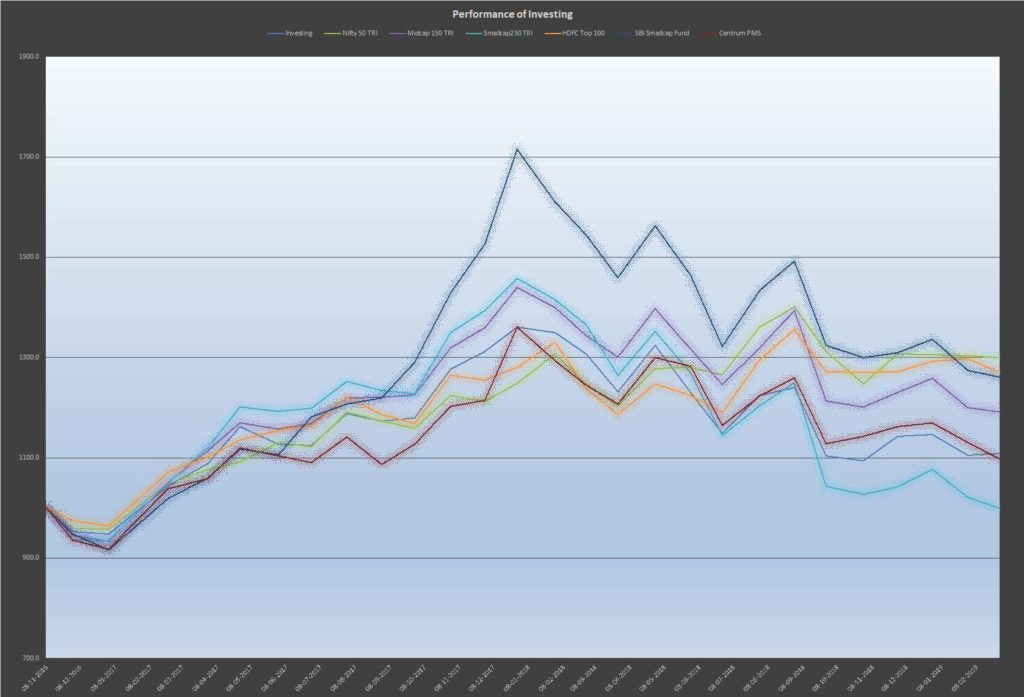
Here is a graph of in investment returns, also as compared to a number of benchmarks.

Investment returns for the period from November 2016 to February 2019, as compared to various benchmarks, including a PMS, TRI Indexes, and top mutual funds.

As you can see, the top performance over the last 2 years or so is no longer the SBI Smallcap fund. Riding on the basis of largecap outperformance throughout 2019 the NIFTY TRI remains the best performer of all benchmarks, followed closely by the HDFC Top 100 Fund.

Again both mutual funds, the HDFC Top 100 and the SBI Smallcap Fund, outperformed both my portfolio as well as the PMS.

Clearly performance is dictated by the kinds of stocks which constitute the portfolio, given the exceptionally large divergence in the returns of a large cap, midcap and small cap portfolio over the last year.

As I write this post, there has again been smallcap and midcap outperformance in the last month. We will see the results next month.

Portfolio Disclosure March 19,2019

Here is a list of the stocks in my portfolio which constitute more than 1% of my investment portfolio. Interested readers may compare it with an earlier portfolio disclosure. I also provide the unrealized gains in terms of percentage.

Ticker% of Portfolio% Unrealized Gains
OBEROIRLTY10.54%107.61%
BAJAJFINSV6.52%850.20%
TATAINVEST4.35%18.17%
BALKRISIND3.41%557.49%
PIIND3.35%141.52%
IDFCBANK3.21%0.07%
ECLERX2.80%1.56%
MUTHOOTFIN2.73%38.89%
IDFC2.68%-41.35%
NESCO2.66%68.05%
INDHOTEL2.65%90.11%
DCMSHRIRAM2.57%234.02%
HINDPETRO2.56%0.47%
AARTIIND2.45%327.95%
BAJAJELEC2.14%133.34%
LT2.02%21.70%
AKZOINDIA2.01%43.26%
RELIANCE2.00%73.33%
MCDOWELL-N1.88%-4.70%
OCCL1.87%894.81%
GRINDWELL1.86%349.22%
CUMMINSIND1.62%82.15%
NMDC1.58%-8.17%
CANFINHOME1.57%426.95%
BHARATFORG1.48%193.60%
ICICIBANK1.47%46.75%
HINDZINC1.42%48.75%
IBULHSGFIN1.31%68.52%
TCS1.29%100.00%
SHILPAMED1.26%98.04%
HDFCBANK1.25%104.67%
AJANTPHARM1.20%91.17%
KRBL1.19%618.77%
IRB1.18%12.79%
MUNJALSHOW1.16%4.56%
MAYURUNIQ1.08%156.50%