Here is a list of the stocks in my portfolio which constitute more than 1% of my investment portfolio. Interested readers may compare it with an earlier portfolio disclosure. I also provide the unrealized gains in terms of percentage.
After a very disheartening trading performance in August 2018, September 2018 gave stupendous returns. This was due to an extremely sharp fall in the Bank Nifty, and an extremely sharp rise in bond yields. This behavior is not unexpected, but the correlation of bond yields and the Bank Nifty does lead some degree of correlation, which is not what was expected while diversifying to a new instrument.
Unfortunately, I stopped trading commodities a few months ago, and I also reduced the position size on bond futures. The commodities was a conscious choice, because I wanted to refine my strategies and also see if existing strategies did have an ‘edge’. The bond futures position size reduction was a ‘fear’ thing.
Nevertheless, the nice returns on the bank nifty in September were a nice bonus. It also meant that I have positive 1 year returns. And of course, since the inception of measurement, i.e., November 2016, it means a return of almost 200%.
As of now, there are 3 operating trading segments:
a) Trend Following on the Bank Nifty, which constitutes nearly 70% of the total position. This is on various time frames, with shorter time frames having 50% of the positions, and daily time frame having 50% of the position
b) Trend Following on Yields, to trade on bond futures
c) Mean Reversion Systems on individual stock futures
Currently, momentum trading on commodities is in suspension. Also, I very occassionally do options plays. In the beginning of October, I have also started trend following in individual stocks(taking delivery).
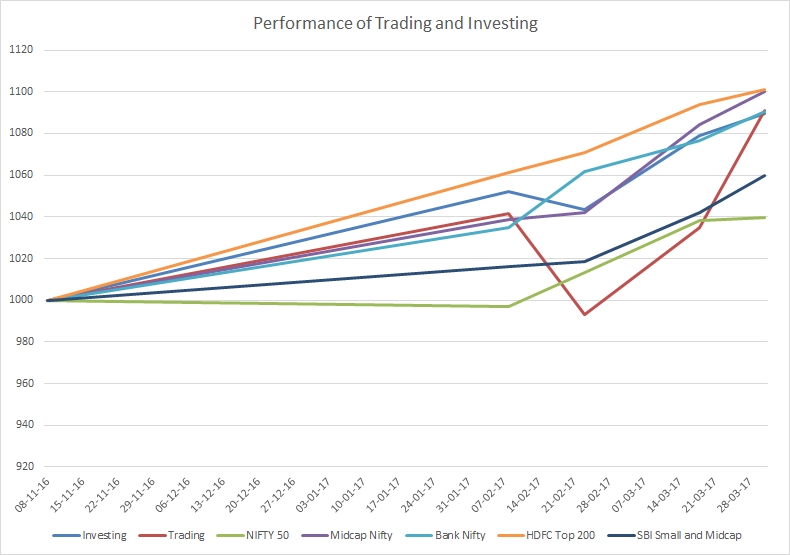
Investment and Trading Performance Compared with Various Benchmarks
September 2018 was not a good month for my investment performance. My portfolio fell by nearly 11% in a single month. The only saving grace was that it did not underperform most benchmarks. The SBI Small Cap fund fell even more, and the Centrum PMS and Bank Nifty did almost as badly.
The Centrum PMS was 25% in cash by the end of September. As a ‘Buy and Hold’ Investor, one does not have the luxury of moving to cash.
But as I approach 5 years of active investing, and nearly 2 years since I have kept perfect records, one has to ask oneself hard questions. Since Nov 2016, my portfolio has significantly underperformed good mutual fund schemes. It may not have underperformed the average of all equity mutual fund schemes, but it has not outperformed such an average either.
It is clear, from the record of 2 years, that something needs to change. I would question the need for me to study companies, look at balance-sheets, attend con-calls, and the like. Isn’t it better to spend my time in other pursuits, and invest in a few good mutual funds instead?
But of course, I also need something to do. And for that, I would question the validity of ‘Buy and Hold’ investing for the entire portfolio. In the next month, I intend to post a paper on the logic of doing trend following on individual stocks, and hope to post results of back testing such strategies over the last five years. I hope I can convince myself, and others, that price action in the markets, is much more critical for markets, than fundamental analysis. I have no doubt that fundamental analysis is a valid approach, but I do feel that it leaves out a valuable component of the investing process. And that is time. If markets don’t ‘discover’ the value stock, no matter how good the analysis and how correct the thesis, it can be a long time before the market assigns the stock the multiple it may ‘deserve’. And during this time, there may be another stock which fully deserves a look.
So for my incremental investing, I intend to stop investing on a fundamental basis. Incremental cash will go to a long/flat portfolio, where candidates are identified using trend-following methods. Fundamental analysis will be used to rule out investment in certain stocks, more in a negative sense than in a positive one.
Here is a figure which gives the investment performance for September 2018, along with a comparison with other benchmarks.
Investment performance from November 2016 to September 2018 compared with various benchmarks.Investment and Trading Performance Compared with Various Benchmarks
Pls see below my portfolio (limited to those stocks which constitute at least 1.5% of the portfolio):
Ticker
% of Portfolio
%Gain
OBEROIRLTY
9.90
132.74
BAJAJFINSV
4.03
764.79
BALKRISIND
3.60
728.33
IDFCBANK
3.50
38.26
IDFC
3.28
-14.19
HINDPETRO
3.06
295.64
ECLERX
2.87
98.13
NESCO
2.84
114.28
DCMSHRIRAM
2.84
339.78
PIIND
2.78
138.99
SPARC
2.14
246.60
INDHOTEL
2.13
82.36
MCDOWELL-N
2.09
41.59
RELIANCE
2.01
124.17
IBULHSGFIN
1.92
196.66
OCCL
1.91
1117.00
BAJAJELEC
1.89
145.80
CANFINHOME
1.81
1100.05
SHILPAMED
1.79
526.03
KRBL
1.78
1200.07
NMDC
1.75
19.26
BHARATFORG
1.74
313.36
MUNJALSHOW
1.72
85.35
AKZOINDIA
1.69
64.44
CUMMINSIND
1.69
127.08
TATAINVEST
1.67
71.89
LT
1.65
75.55
IRB
1.63
86.47
HMVL
1.57
29.40
As before, for Canfin Homes, KRBL, Shilpa and Bajaj Finserv, the % gain is after including profits on sales carried out.
The only sales since the last portfolio disclosure have been in EClerx. This has primarily to do with the rise in the price due to Buyback announcement. I fully intend to purchase back the stock once the buyback record date is over.
There has been a sharp rise in the price of Oberoi Realty, IDFC Bank and IDFC. This accounts for the relative percentage increase. Similarly, there has been muted performance in Balkrishna Tyres. All of these are long term stocks, so the relative performance is not, per se, especially interesting.
My current portfolio is extremely diversified, but the top holdings (which constitute approx 80% of the total portfolio) is disclosed here.
Pls note that the total return here does not include dividends. In a few stocks-NMDC, AkzoNobel and HindZinc, accounting for dividends would have changed the return considerably.
In a few stocks, the purchase value is reduced by the profit booked. This is true of CanFin Homes, Shilpa Medicare, Bajaj Finserve and KRBL. This is why the return seems absurd. In any case, each of the stocks has returned around 10-15X, even if I don’t account for profits booked.
Below is a graphical representation of my investing performance upto July 2017. Further below is a table of returns.
My investing performance relative to other benchmarks
First, some housekeeping. You will notice that this graph is different from earlier ones, where I had also mentioned my trading performance. The reason for this change is simple. The trading performance in July was simply crazy. So if this line is also added to the above graph, then the range on the axis changes in such a manner that there is no possibility of distinguishing between the various investment benchmarks. In addition, there is difficulty in understanding what the exact trading capital is. As a result, it is best to look at trading and investing performance separately, and maybe, once a year or so, revisit a comparison. In any case, below, I also present a table which details the returns on trading along with investing benchmarks.
As can be seen from the graph above, and the table below, the trend established earlier still continues. The mutual funds outperform my investment performance, which outperforms the PMS schemes from Motilal Oswal and Centrum. All of them outperform index benchmarks, except the Bank Nifty Index.
My investment performance continues to be marred by underperformance of my biggest holdings-IDFC, IDFC Bank and Oberoi Realty. On the other hand, Bajaj Finserv continues to outperform, as to other stocks like Indiabulls Housing Finance.
In July, I also converted about 4% of my portfolio to cash. I also made a concerted effort to pare down the number of stocks in my portfolio (from around 100 to around 75). I will continue this exercise of bringing down the portfolio size to around 30-40 stocks over the next one year. Among my larger holdings, I have completely exited Muthoot Capital Services (and have partially switched to Muthoot Finance), Munjal Auto (and partially added to Munjal Showa), Alkyl Amines and Bayer Cropsciences (and have partially switched to PI Industries and also added Tata Chemicals). I have further exited IL & FS Investment Managers. I have also exited Tata Steel (and switched to Vedanta and Tata Investment Corportation). I have exited Sobha Developers and added to NESCO. I have exited Vardhman Acrylics and added to Vardhman Textiles. I have also exited JP infratech and JP Power and added to Jain Irrigation. I have further added to IRB infra and Pokarna. I continue to slowly accumulate Pharma Stocks (Sun and Dr Reddy’s). I have completely exited my small positions in Hindalco, EIH, IL&FS Transportation Networks, Federal Bank, Laxmi Vilas Bank. Finally, I have finally exited MPS ( a large holding) and added to EClerx.
All of these switches have been done more to reduce the number of stocks I want to track, than any fundamental reasons. In some instances (like MPS), I did not like the business prospects. In some cases (Bayer or Munjal Auto), I just felt that the price had run ahead of the business.
Here is a table of my investment returns compared with various other benchmarks.
The following stocks constitute at least 1% of my portfolio as on March 31, 2017. These 39 stocks amount to 81% of my total investment portfolio.
Holdings which constitute at least 1% of Investment Portfolio
Some discussion is warranted. The average age of my holdings is around 2 years, and as can be seen, there are very few stocks in the red. These include United Spirits (McDowell), ILFS Investment Managers (Which has given great dividends though), IDFC and IDFC Bank Combo (Which on the other hand is a looong term bet). NMDC has barely broken even. Even with NMDC, the dividends have been great.
Where have the best gains come from: Clearly Can Fin Homes, KRBL and Oriental Carbon have given the best percentage gains. I bought all of these when the markets were at a trough in September 2013. The largest absolute gain has come from Bajaj Finserv, which was again bought in the same period.
I am reasonably happy with the overall portfolio mix. It consists of realty (Oberoi and NESCO), MNC (Cummins, United Spirits, Akzo, Grindwell Norton), Pharma (Shilpa and Ajanta), NBFC (Bajaj Finserv, Canfin Homes, IndiaBulls Housing Finance), Banking (IDFC and IDFC Bank), Great Indian Mid to Small Cap Companies with an export focus (Balkrishna Tyres, Bharat Forge, PI, Aarti Industries, Polymedicure, Mayur, OCCL), and IT (Eclerx, MPS). There is considerable diversification. However, I am comfortable with the diversification.
Again, I would like to emphasize that over a period of time, I expect to see the allocation to real estate decreasing, and the exposure to trading equity increase. I would also like to steadily add to the stock of bullion and low yield instantaneously redeemable debt in the portfolio to increase, to add to the stability of my trading business.
My goal is simple: To derive a 15-20% return on investment over the long run. I shall be quite satisfied if over several years, I am able to achieve this goal. Portfolio composition is very critical to achieving this goal. Too much exposure to “safe” low yield debt, and I would not be able to achieve the goal. On the other hand, too little exposure to instantaneously redeemable low yield debt would mean that I would not have the opportunity to invest in the market when it is down and out.
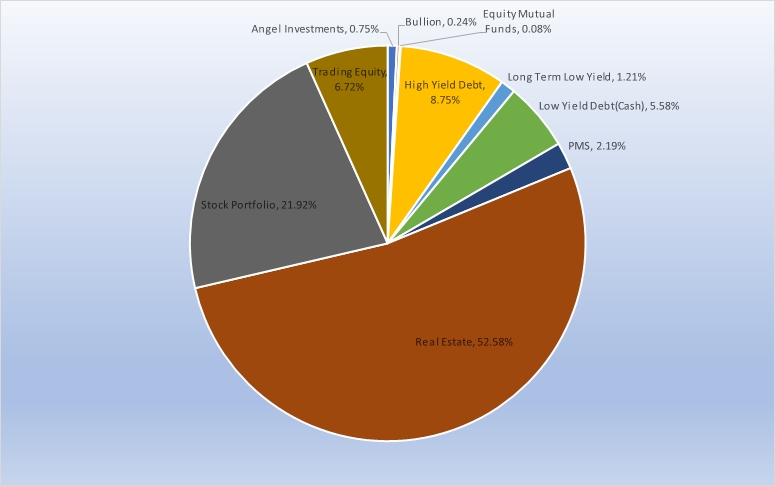
While much of the discussion here is on financial markets, my personal investments are more diversified. More than 50% of my investments are in real estate (including my self occupied house and office*). My equity investments (including PMS, Equity Mutual Funds and Direct Equity) amount to less than 25% of my total investment. Trading Equity(**) amounts to less than 7% of my entire set of investments.
Over time, I expect to see movement in this portfolio composition, with the relative allocation to equity increasing, the allocation to indian real estate investments decreasing, the role of overseas real estate investment increasing (from zero presently), the allocation to angel investments increasing and the role of bullion rising to around 2% of porfolio.
Notes
P.S. * I debated whether to include my self occupied house and office in my total investments. The reason for the debate is that you are unlikely to sell your house or office, so why include them in the mix. I eventually included them, because both are really too large for my long term needs. They are fungible, because I could also move to smaller spaces at a much lower cost.
P.P.S. ** While the amount of trading equity is only 6.7%, in reality, it is larger, if I include the cash I hold in reserve for drawdowns, and the stocks that I can give as margin for trading.