After a stellar performance in January, February 2018 did not turn out to be great from a trading point of view. This poor performance was also dictated by the fact that I behaved in a really stupid manner and in a discretionary way, I overrode my system for a considerable number of days. It was not very clever, and I think that the motivation was to protect the returns I made in January. However, the net effect, I believe was that it further depressed the results. I am not at all proud of this moment of weakness.
Here is a table of the trading returns for the month(Click to zoom in for a better view):
Investment and Trading Performance in January 2018
February 2018 was not a good month for investment returns. In my view, four things led the market to crack:
Imposition of LTCG on equity in the Union Budget. Totally unnecessary tax in my opinion, which was a huge sentiment burster for markets.
A sharp rise in commodity prices, as well as a sharp drop in Unemployment in developed economies, which portends the return of inflation, rise in interest rates, and diversion of funds to debt markets from equity markets
Loss of key byelections by the ruling party, which made the return path of Narendra Modi in 2019 somewhat hazier.
The Nirav Modi-Mehul Choksi Scam which did so many things-it totally destroyed whatever faith was left in PSU Banks, it was a huge whammy for the reputation of the NDA regime, and a huge blow to middle class morale.
Whatever the narrative may be, and you can believe or not believe any of the above, markets nevertheless fell, and sharply. The Bank Nifty, which was up about 7.2% in January 2018, fell by more than 8% in February. Mutual funds like HDFC Top 200 fell sharply. A PMS like Motilal Oswal did not do so badly, since it was invested primarily in ‘quality stocks’.
My investment performance, like always fell somewhere in the middle. Nevertheless, if Iook at performance over a year, I outperformed all the benchmarks, except the SBI Small and Midcap Fund.
In portfolio changes, I again spent some effort to prune my portfolio. Again, the timing was quite wrong, and it still makes me wonder about my psychological strength in coping with market rises and falls. Again the net implications are small (less than 1% of portfolio size). Nevertheless, the timing is certainly off.
The investment performance is summarized in the graph and table below. Click on them for a zoom view.
Investment Performance February 2018 compared to various benchmarksInvestment and Trading Returns February 2018
My trading performance since August 2017 has been nothing short of disastrous. While I am still ahead for the year, at this point, had the same capital been invested in stocks, I might well be ahead. However, that is in the nature of the trading game. Most of the time, the returns are below the peak returns, and in addition, there are often sharp drawdowns in this business. This is where mindset, stoicism and capital come into play. I like to think that I have these in abundance. Then it is only a game of waiting. Markets will give you a sharp break on either side, which will develop into a nice trend to capture profits. It just requires the patience to hold on, till the ride comes along. But I can see why many people don’t succeed here.
Here is a table of the returns:
Table of portfolio returns and trading performance for December 2017
December 2017 was a great month for markets, especially in the small and midcap segment. The portfolio as a whole continues with its underperformance of the small and midcap space, and its outperformance of the large cap space. Financials did not have a great time in December, and given the high weight of financials in the portfolio, some level of underperformance was to be expected.
The SBI Small and Midcap Fund has a complete blowout. Even the Centrum PMS had a blowout month, with the result that its performance almost caught up with my portfolio returns.
Here is a graphical representation of the monthly returns:
Graphical Representation of the portfolio returns in December 2017, relative to different benchmarks
Following is the same thing in the form of a table:
Table of portfolio returns and trading performance for December 2017
September 2017 was a time when markets took a small pause. All indices took a small hit over the values of end-A
ugust 2017, and were even more down compared with end-July 2017. Midcaps and small caps till better than large caps.
Accordingly, my investment performance also suffered, though I still managed to eke out a postive return for the month. This is primarily due to the higher contribution of midcap and small cap stocks in my portfolio.
The SBI Small and Midcap Fund was the standout for the month, rising more than 5% in a month. So was the Centrum PMS. Both of these did better than my own investments. Centrum PMS came back to life after a nice break. The Motilal Oswal PMS continues to languish. September was also not a good month for the HDFC Top 200 fund.
Here is a graphical representation of the above. As time goes on, clearly, the men are getting separated from the boys.
Graphical Representation of the investment performance compared to several benchmarks.
And for those who prefer numbers, here is the same data in numerical format.
Comparison of investment and trading performance of my portfolio and trading activity relative to various benchmarks
Below is a graphical representation of my investing performance upto July 2017. Further below is a table of returns.
My investing performance relative to other benchmarks
First, some housekeeping. You will notice that this graph is different from earlier ones, where I had also mentioned my trading performance. The reason for this change is simple. The trading performance in July was simply crazy. So if this line is also added to the above graph, then the range on the axis changes in such a manner that there is no possibility of distinguishing between the various investment benchmarks. In addition, there is difficulty in understanding what the exact trading capital is. As a result, it is best to look at trading and investing performance separately, and maybe, once a year or so, revisit a comparison. In any case, below, I also present a table which details the returns on trading along with investing benchmarks.
As can be seen from the graph above, and the table below, the trend established earlier still continues. The mutual funds outperform my investment performance, which outperforms the PMS schemes from Motilal Oswal and Centrum. All of them outperform index benchmarks, except the Bank Nifty Index.
My investment performance continues to be marred by underperformance of my biggest holdings-IDFC, IDFC Bank and Oberoi Realty. On the other hand, Bajaj Finserv continues to outperform, as to other stocks like Indiabulls Housing Finance.
In July, I also converted about 4% of my portfolio to cash. I also made a concerted effort to pare down the number of stocks in my portfolio (from around 100 to around 75). I will continue this exercise of bringing down the portfolio size to around 30-40 stocks over the next one year. Among my larger holdings, I have completely exited Muthoot Capital Services (and have partially switched to Muthoot Finance), Munjal Auto (and partially added to Munjal Showa), Alkyl Amines and Bayer Cropsciences (and have partially switched to PI Industries and also added Tata Chemicals). I have further exited IL & FS Investment Managers. I have also exited Tata Steel (and switched to Vedanta and Tata Investment Corportation). I have exited Sobha Developers and added to NESCO. I have exited Vardhman Acrylics and added to Vardhman Textiles. I have also exited JP infratech and JP Power and added to Jain Irrigation. I have further added to IRB infra and Pokarna. I continue to slowly accumulate Pharma Stocks (Sun and Dr Reddy’s). I have completely exited my small positions in Hindalco, EIH, IL&FS Transportation Networks, Federal Bank, Laxmi Vilas Bank. Finally, I have finally exited MPS ( a large holding) and added to EClerx.
All of these switches have been done more to reduce the number of stocks I want to track, than any fundamental reasons. In some instances (like MPS), I did not like the business prospects. In some cases (Bayer or Munjal Auto), I just felt that the price had run ahead of the business.
Here is a table of my investment returns compared with various other benchmarks.
It’s the 10th of the month again, and its time for another update on performance. Nothing really new to report, except that I started trading commodity futures in earnest in June, and had I not, trading performance would have been weak. This has only strengthened my conviction that diversification across uncorelated instruments is important while using trading systems.
The rest was more of the same. The mutual funds outperformed my own investment performance, which in turn outperformed the PMS benchmarks. Something for the PMS folks to think about.
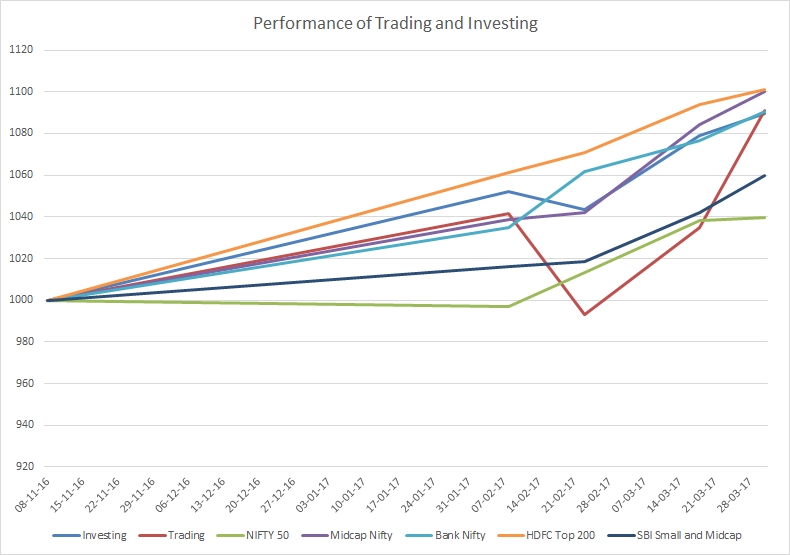
Again, after a haitus, I present my trading perfonmance and investment performance.
Here is a graph of my performance, both for trading and investment, in comparison with various benchmarks. The benchmarks I have included are the performance of the HDFC Top 200 and SBI Small and Midcap Funds, and two PMS’s I have invested in, the MOSL Value Strategy, and the Centrum Deep Value Strategy, in addition with 3 indexes.
Trading Returns and Investment Returns
As can be seen, the trading has had a great last few months. However, there is a caveat here. In my base calculation for capital employed (i.e., the 1000 figure in November), for trading, I have only included the actual capital employed in my brokerage accounts, and not the shares pledged as margin, or the reserve cash I hold. Still, all in all, a creditable performance.
My investment performance in the last seven months is also not bad, second only to the HDFC Top 200 Fund. I otherwise beat both the PMS’s and the indexes handily.
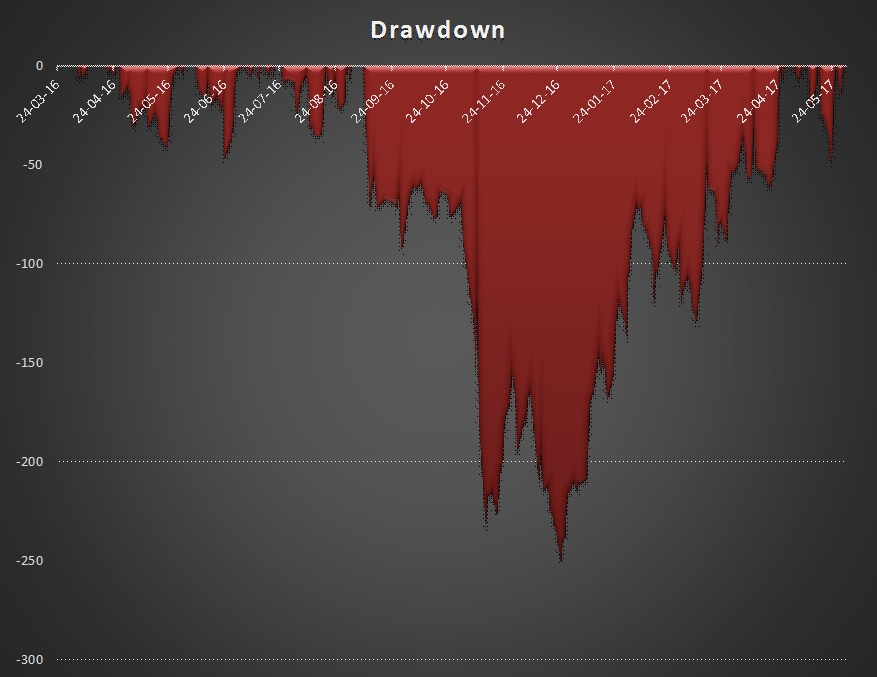
What risk did I take to get these stellar trading returns? Quite a bit. Please see below:
Absolute trading equity line.
As can be seen, there is a deep drawdown in the months of October and November 2016. This corresponded to three external events, Brexit, Trump Election and Demonetization. Such deep drawdowns are what keeps one afraid of trading in futures. I have since changed strategies (more in another post), and hopefully, I can avoid such sharp drawdowns in the future.
The following stocks constitute at least 1% of my portfolio as on March 31, 2017. These 39 stocks amount to 81% of my total investment portfolio.
Holdings which constitute at least 1% of Investment Portfolio
Some discussion is warranted. The average age of my holdings is around 2 years, and as can be seen, there are very few stocks in the red. These include United Spirits (McDowell), ILFS Investment Managers (Which has given great dividends though), IDFC and IDFC Bank Combo (Which on the other hand is a looong term bet). NMDC has barely broken even. Even with NMDC, the dividends have been great.
Where have the best gains come from: Clearly Can Fin Homes, KRBL and Oriental Carbon have given the best percentage gains. I bought all of these when the markets were at a trough in September 2013. The largest absolute gain has come from Bajaj Finserv, which was again bought in the same period.
I am reasonably happy with the overall portfolio mix. It consists of realty (Oberoi and NESCO), MNC (Cummins, United Spirits, Akzo, Grindwell Norton), Pharma (Shilpa and Ajanta), NBFC (Bajaj Finserv, Canfin Homes, IndiaBulls Housing Finance), Banking (IDFC and IDFC Bank), Great Indian Mid to Small Cap Companies with an export focus (Balkrishna Tyres, Bharat Forge, PI, Aarti Industries, Polymedicure, Mayur, OCCL), and IT (Eclerx, MPS). There is considerable diversification. However, I am comfortable with the diversification.