Trading Performance May 2017
Investment Performance May 2017
Again, after a haitus, I present my trading perfonmance and investment performance.
Here is a graph of my performance, both for trading and investment, in comparison with various benchmarks. The benchmarks I have included are the performance of the HDFC Top 200 and SBI Small and Midcap Funds, and two PMS’s I have invested in, the MOSL Value Strategy, and the Centrum Deep Value Strategy, in addition with 3 indexes.

As can be seen, the trading has had a great last few months. However, there is a caveat here. In my base calculation for capital employed (i.e., the 1000 figure in November), for trading, I have only included the actual capital employed in my brokerage accounts, and not the shares pledged as margin, or the reserve cash I hold. Still, all in all, a creditable performance.
My investment performance in the last seven months is also not bad, second only to the HDFC Top 200 Fund. I otherwise beat both the PMS’s and the indexes handily.
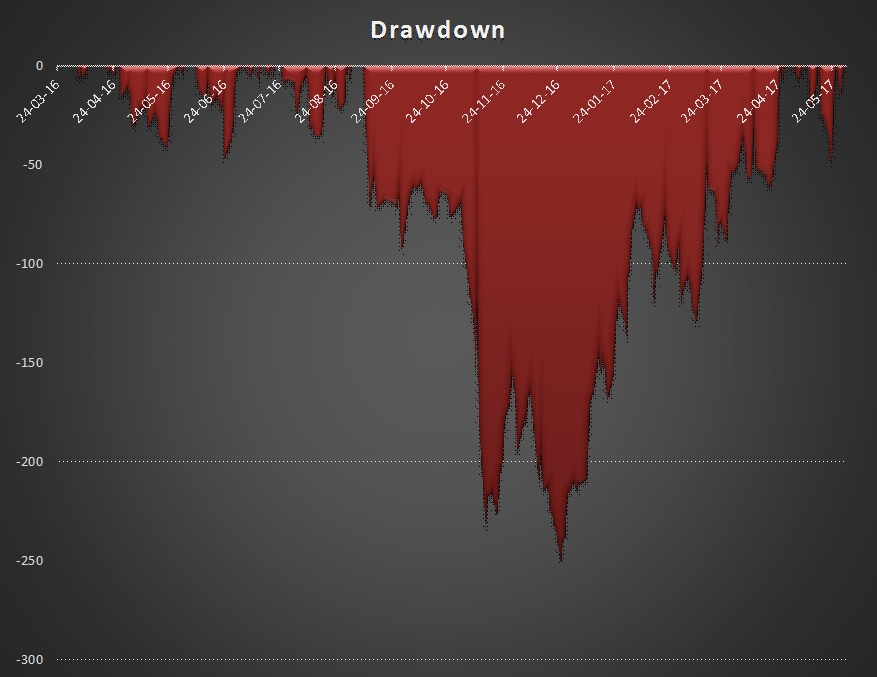
What risk did I take to get these stellar trading returns? Quite a bit. Please see below:

As can be seen, there is a deep drawdown in the months of October and November 2016. This corresponded to three external events, Brexit, Trump Election and Demonetization. Such deep drawdowns are what keeps one afraid of trading in futures. I have since changed strategies (more in another post), and hopefully, I can avoid such sharp drawdowns in the future.